As a Liverpool fan, Arne Slot talking about the “Arne Slot Pass”, a pass received from the full back and played immediately in-behind the defenders, ignited my curiosity. In just a sentence, Arne put some words on a hunch I had been having for a while. Along with that hunch were questions; is playing the ball behind the defenders important? Are there better areas to do it? How valuable are those? Let’s try to bring up some answers in this post.
What is the Pass in-Behind (PiB)?
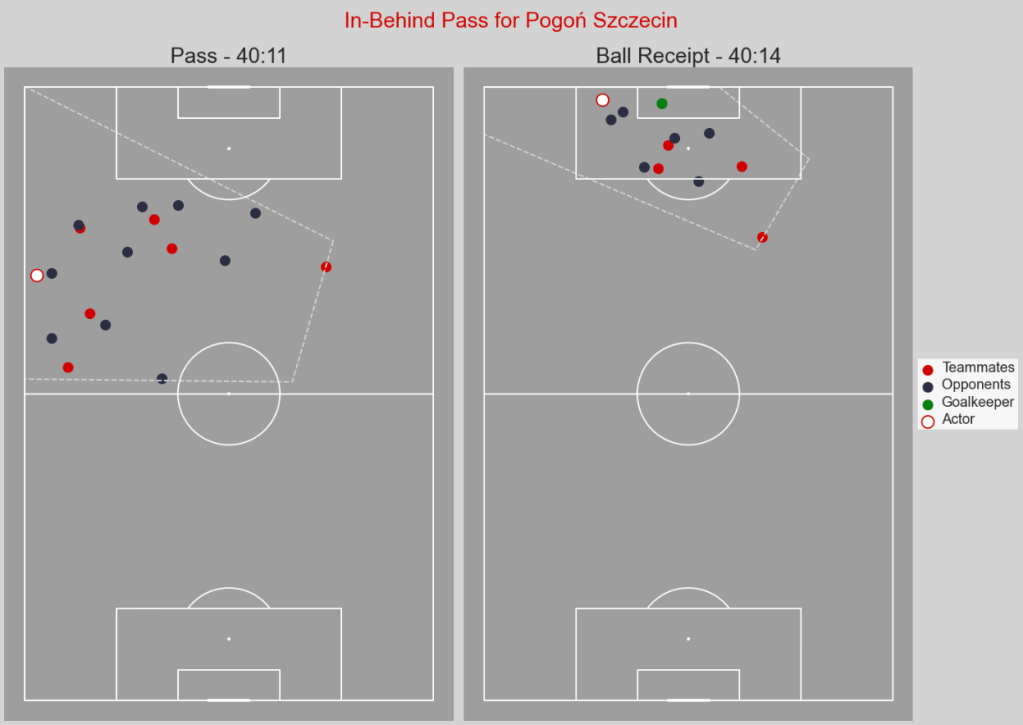
The Pass in-Behind is a pass that is played somewhere between the goal line and the closest defender to the goal-line. A successful PiB is received by a teammate onside. Here is an example from my beloved Polish Ekstraklasa of the pass and the subsequent receipt.
What is the hypothesis?
Football is a game of control, whether in possession working the ball up the field, or out of possession with rest defense and occasional moments of improvisation. The PiB could be the moment the game goes from a controlled phase to an improvised phase. Indeed, when the ball is moved behind the defense, the team in-possession forces their opponents to take a decision in order to stop attackers from running through on goal virtually unopposed.
On top of this hypothesis, it will be insightful to analyse who play and receive those passes. Would those correlate with possession value models like Pass On-ball Value?
Finally, we will observe what those Passes in-Behind tell us about teams and leagues.
Methodology
To find those Passes in-Behind, I’ve chosen to use data from Statsbomb 360 using the “big 5 leagues” and the English Championship, since 2020-21. While other tracking data solutions could have been used, the 360 data from freeze frames allow us to view the pass, the subsequent receipt and the off-ball positioning of defenders. As we’re analysing seasons-worth of data, this offers a reliable and light-weight compromise. The identification of the opposition defenders, one of the shortcomings of 360 is also not necessary in this research.
Creating a metric also means making choices so I’ve outlined those below:
I chose to include set-pieces, mainly for two reasons. Throw-ins are the only set-play where offside teammates can legally be played. Quick free kicks playing teammates in-behind are also too valuable to ignore.
The other choice was to only keep passes played in the opposition half. With Statsbomb 360 data limited to players visible in the camera frame, excluding passes in the defensive half helps eliminate those false positives.
To verify that my system has an acceptable degree of accuracy, I matched every action pulled to the related video timestamp thanks to Wyscout. Some events missed that defenders may be positioned outside of the frame. I thought of changing to Final third passes only to further increase accuracy, but that led to some quick passes played on the counter being missed.
Results
PiBs symbolises the Transition from Control to Chaos
Football is often a rhythm game: teams establish passing patterns, positional play, and zones of control. But the moment a PiB is played, this equilibrium shifts. Our analysis confirms that PiBs regularly act as the spark that turns a slow buildup into a potentially high value attack.
This is particularly evident when we analyse PiBs individually. The successful reception of a PiB means that defenders will have to move out of their controlled state.
Across all leagues in the dataset, PiBs most often originate just inside the opposition half, typically after a phase of controlled possession. Players like Alexander-Arnold or Pedri receive the ball in structure and have the ability to immediately shift the team into an improvised, reaction-driven phase by playing a pass behind the backline. These moments force defenders to make quick decisions: drop, step up, or track a runner, often while facing their own goal. In this light, PiBs are less about creation through buildup and more about disruption.
A notable outlier in our findings is Manchester United’s Bruno Fernandes who completed the highest number of PiBs in the 2024-25 dataset. The takeaway from it though? I’m not too sure. I think it tells us more about Bruno’s passing ability than United’s playing style.
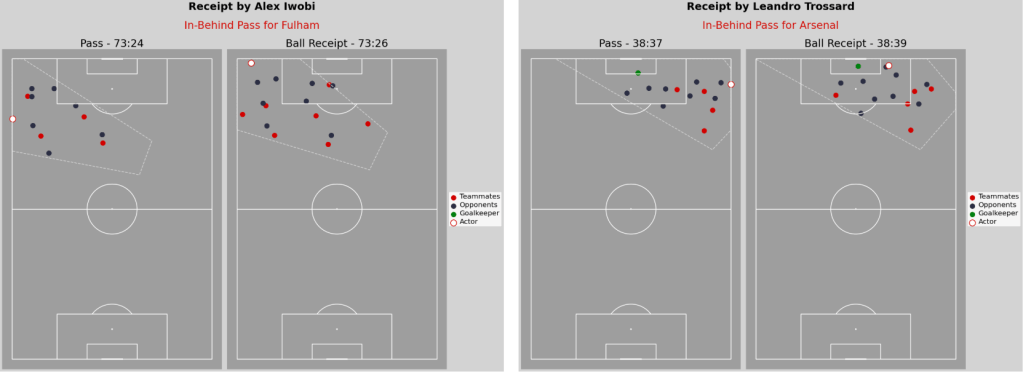
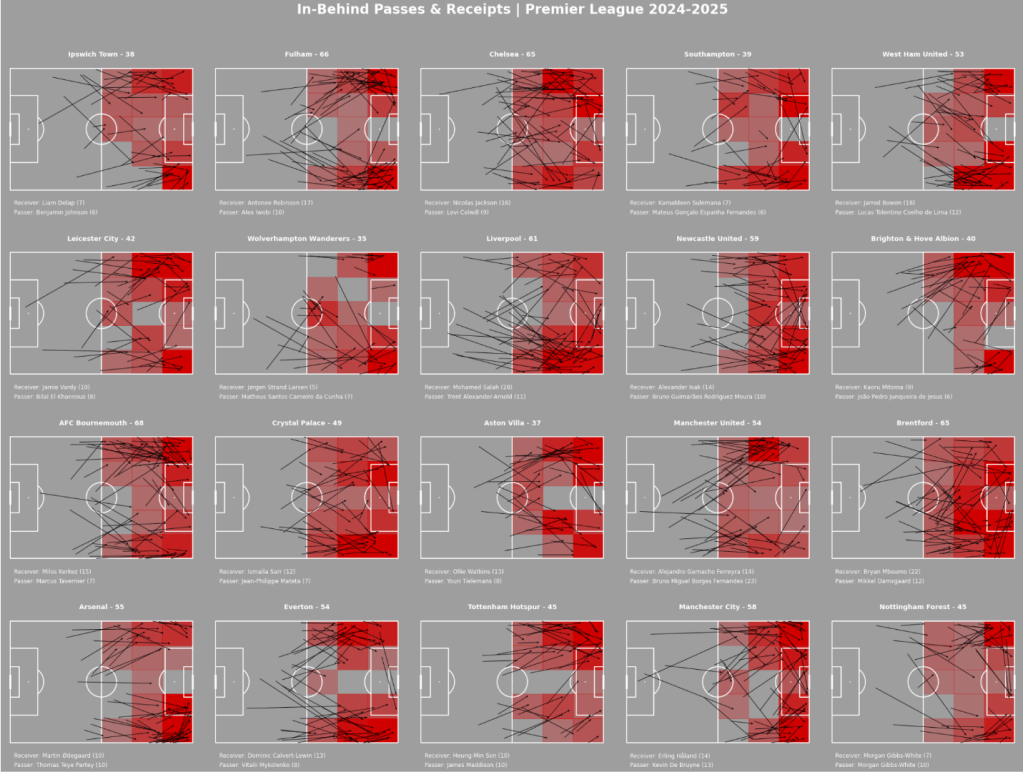
An important part of the game to consider here are the throw-ins. You will notice on the league-wide visuals below that some teams like to maximise them to play the ball behind the defense. Arsenal and Fulham have used those opportunities to get the ball close to the byline. In the case of Arsenal, that was particularly noticeable on the right-hand side.
Are PiBs Valuable?
While not all PiBs lead to direct shots or goals, they frequently generate high On-Ball Value (OBV) numbers.
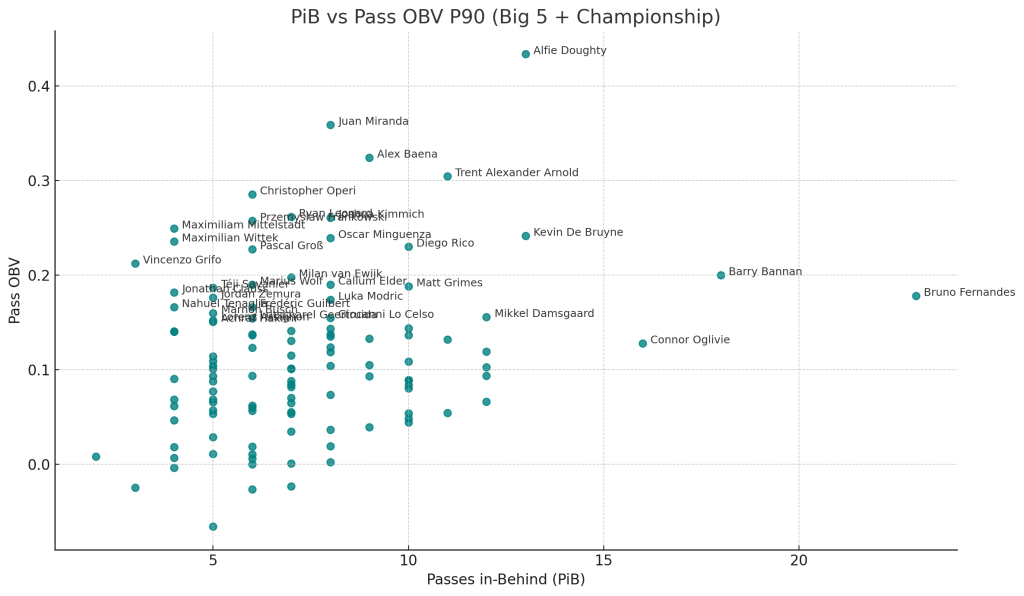
In fact, the top players in PiBs in different leagues tend to be the ones scoring the highest in OBV.
Trent Alexander-Arnold, Bruno Fernandes or Kevin de Bruyne are all high-OBV players completing a high number of PiB. The same is true in Spain, with Alex Baena, Minguenza and Diego Rico or even Modric featuring highly in both. Such cases of high OBV and high number of PiBs can be found. However, while high PiB players will often coincide with higher OBV performers, the opposite does not verify. PiBs can just be seen as one useful tool to increase threat through passing. Below is a breakdown of how frequent in-behind passers perform in terms of Pass On-Ball Value. Remember, those may include set-pieces!
National Specificities
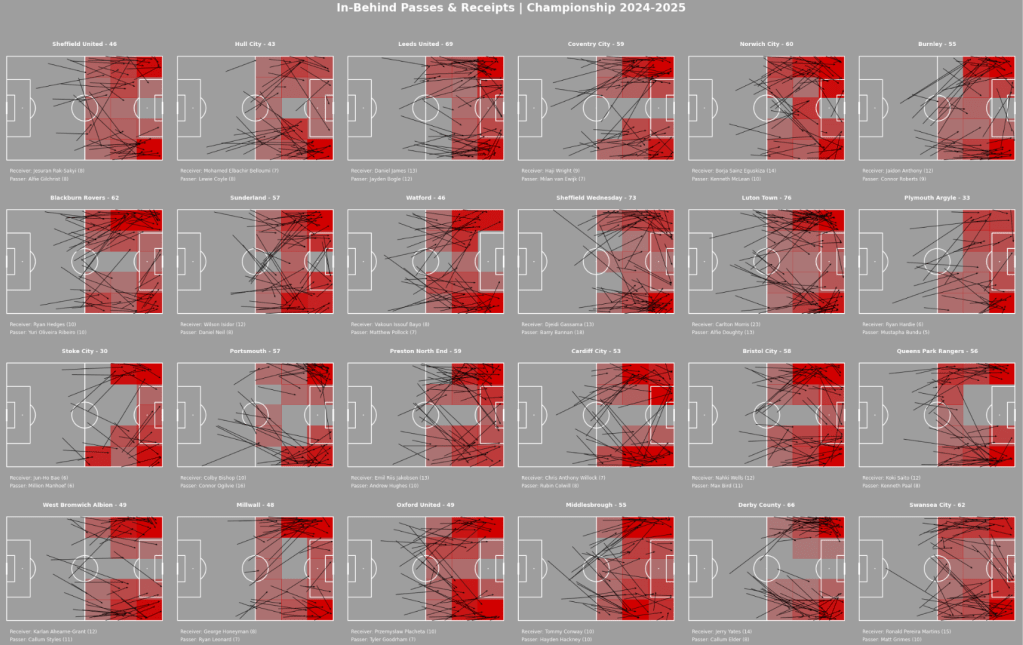
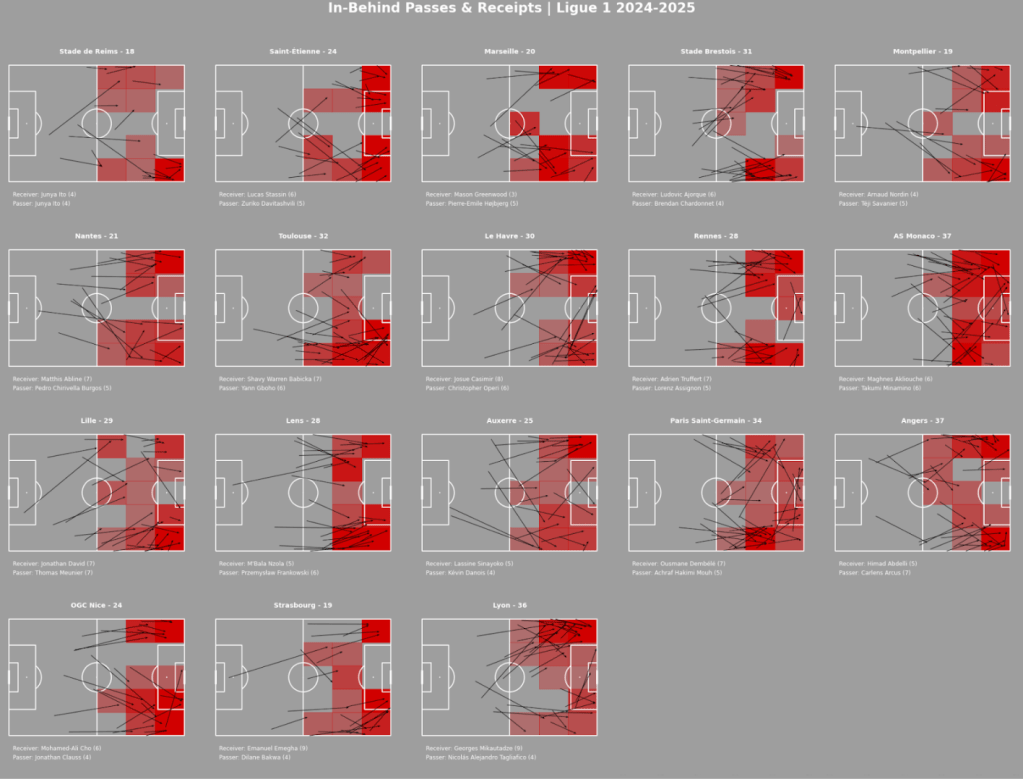
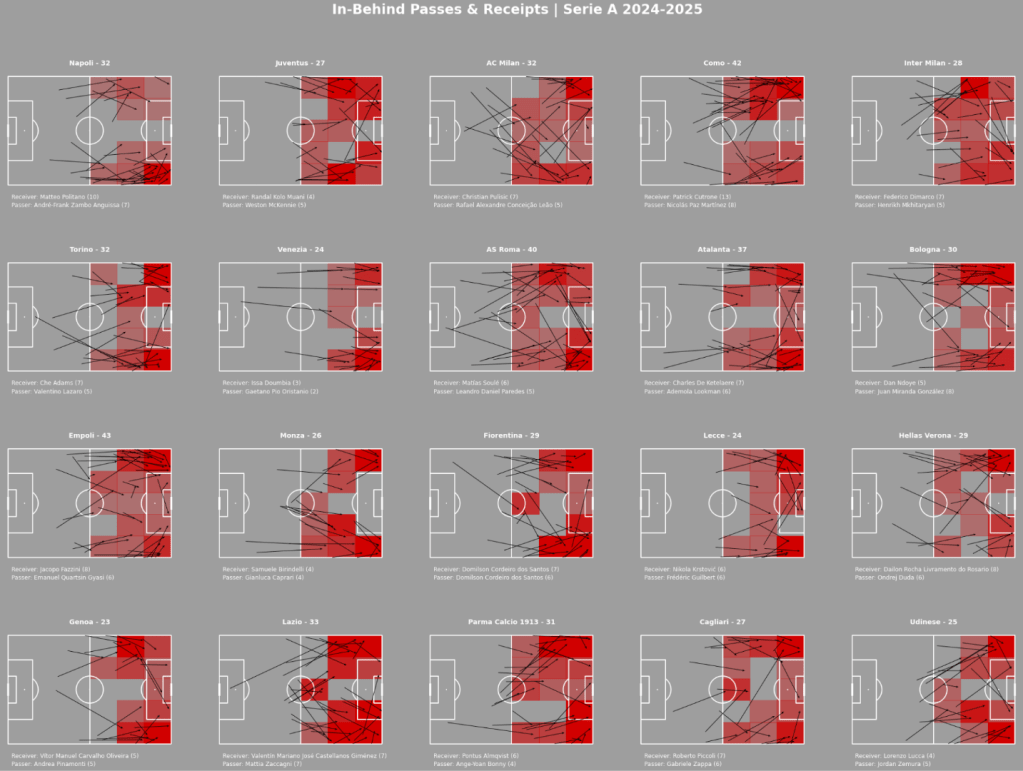
The distribution of PiBs across leagues (since 2020-21) reveals a lot about team strategies, and has given us an unexpected eye opener in terms of playing styles across different leagues.

Teams in England and Scotland post a much higher average number of PiBs than other leagues we studied. They complete almost double (53) of the average French (27) or German team (28). Italy (33), Spain (40). Is this enough to say that some countries are more risk-averse than others?
Interestingly, the higher number of PiB extends to the Championship, with everyone except Stoke and Plymouth boasting a high number of PiB (>1 per game for almost everyone!). Could this be a specificity of British Football?
Some teams present a paradox. Monaco is one of them, consistently among the top for PiBs played and PiBs conceded, suggesting aggressive pressing and vulnerability in rest defense.
These league-level trends reinforce the idea that PiBs aren’t just an isolated tactic, but something that can differentiate one competition from another.
Finally, the Pass in-Behind can tell us a good deal about the attacking intent of teams.
In our visual representations shown here, we quickly identify the areas teams will try to target.
While a great deal of teams will find space in-behind on the flanks, some will try to find the half-spaces, or even the box! Dortmund and Leverkusen give us a great example of a stylistic difference.

The PiBs also reveal information about player usage, particularly full-backs. Some teams will employ them as passers, trying to find that space in-behind while for others, full-backs will be the targeted recipients of those.
To conclude, the Pass in-Behind is one of the deliberate exits from structured possession play. Those able to complete them on a regular basis are highly valuable players.
The potential for PiBs to frequently turn possession into dangerous attacking moments by forcing defenders into uncomfortable, reactive decisions is confirmed by our visual representations and data.
Moreover, PiBs completed correlate with players and teams that generate value. And while there are many other ways to create danger and generate high value in Possession models such as OBV, PiBs can be an important weapon in the arsenal.
Finally, and perhaps worth further investigation, PiBs are not uniform across football cultures. Some leagues use them sparingly and surgically. Others are happy to risk those difficult passes more often and make PiBs a big part of their attacking strategy. Understanding how and where PiBs occur reveals more about intention than actual chance creation.
As data models grow more sophisticated, integrating PiBs into OBV and xT chains combined with our PiB metric could give us a fuller picture of their use and efficiency.


Leave a comment